วันจันทร์ที่ 11 กุมภาพันธ์ พ.ศ. 2562

Python การ Plot กราฟ แบบต่าง ๆ

import pandas as pd
import numpy as np
import matplotlib.pyplot as plt
df = pd.read_csv('titanic_data.csv')

#ตรวจสอบค่า na
df_pre.isnull().sum()

#ลบค่า na
df_pre.dropna(inplace=True)

df_pre.isnull().sum()

#ลบ Column
del df_pre['Cabin']

#การเตรียมข้อมูล กำหนดค่า na ให้มีค่า ของ Feild  'Age' ด้วย Mean
# โดยเงื่อนไขว่าให้หาค่าเฉลี่ยอายุของแต่ละ Class แล้วเติมค่าใน na
mean1 = df_pre[df_pre['Pclass'] == 1]['Age'].mean()
df_pre.loc[df_pre['Pclass'] ==1,'Age'] = df_pre[df_pre['Pclass'] == 1]['Age'].fillna(mean1)

mean2 = df_pre[df_pre['Pclass'] ==2]['Age'].mean()
df_pre.loc[df_pre['Pclass'] ==2,'Age'] = df_pre[df_pre['Pclass'] ==2]['Age'].fillna(mean2)

mean3 = df_pre[df_pre['Pclass'] ==3]['Age'].mean()
df_pre.loc[df_pre['Pclass'] ==3,'Age'] = df_pre[df_pre['Pclass'] ==3]['Age'].fillna(mean3)

df_pre['Age'].isnull().value_counts()

#Plot โดยใช้ hist  //bins  คือจำนวนแกน
plt.hist(df_pre['Age'],bins=5)

# การใช้ seaborn

import seaborn as sns

# กำหนดขนาดของกราฟ
from matplotlib import rcParams
rcParams['figure.figsize'] = 11.7,8.27 # figure size in inches


# การใช้ seaborn
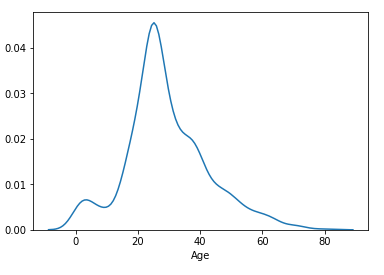
sns.distplot(df_pre['Age'], bins = 10)
sns.distplot(df_pre['Age'], hist=False)

sns.distplot(df_pre['Age'], hist=False, color='red')


sns.boxenplot(df_pre['Age'])
sns.boxenplot(df_pre['Sex'],df_pre['Age'])

sns.boxenplot(df_pre['Pclass'],df_pre['Age'])
sns.violinplot(df_pre['Age'])

sns.violinplot(df_pre[df_pre['Pclass']==1]['Age'], df_pre['Sex'])

sns.kdeplot(df_pre['Age'], cumulative=True)
sns.pairplot(df_pre)

sns.pairplot(df_pre, kind='reg')

sns.jointplot(x='Age', y='Survived', data=df_pre, kind='reg')
sns.catplot(x='Pclass', y='Survived', data=df_pre, kind='violin', height=10)

sns.catplot(x='Pclass', y='Fare', hue ='Survived', data=df_pre, kind='violin', height=10)
sns.catplot(x='Pclass', y='Fare', hue ='Sex_num', col='Survived', data=df_pre, kind='bar', height=10)
sns.catplot(x='Pclass', y='Fare', hue='Embarked_num', col = 'Sex', data=df_pre, kind='violin', height=10)


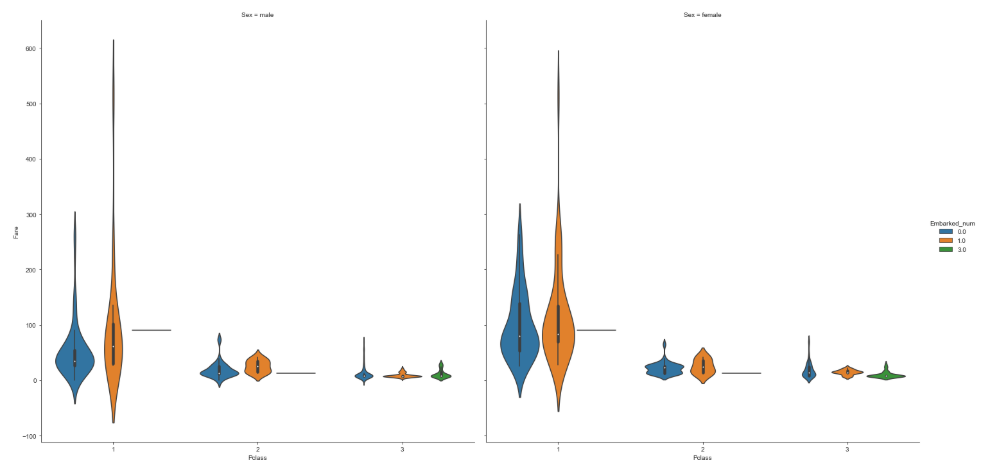
sns.catplot(x='Pclass', y='Fare', hue='Embarked_num', col = 'Sex', data=df_pre, kind='bar', height=10)
df_pre.loc[(df_pre['Embarked']=='Q') & (df_pre['Pclass']==1)]


Python การจัดการ Data ด้วย Insert & Delete & Mean() & Median()

Python 3 for Data Analysis

 - Insert, Delete Data
 - Mean จะเหมือนกับการใช้ Average
 - Median จะเป็นการเอาค่ากลางของข้อมูลมาใช้งาน


# Import Module ที่จะใช้งาน
import pandas as pd
import numpy as np
import matplotlib.pyplot as plt
df = pd.read_csv('titanic_data.csv')

# สำรอง Data Frame
df_copy = df.copy()
#แสดงด้านท้ายขึ้นมา
df_copy.tail()

#เพิ่มข้อมูล insert Data  df_copy.shape[0] = จำนวน Index สุดท้าย
df_copy.loc[df_copy.shape[0]] = [892,1,3,'AAA','male',20,0,0,'AF051B7',8,'C191','S']

#ลบข้อมูล  inplace=True สั่งให้คำสั่ง Update
df_copy.drop(df_copy.iloc[[892]].index)
#กรณีลบ Record สุดท้าย df_copy.shape[0]-1
df_copy.drop(df_copy.iloc[[df_copy.shape[0]-1]].index, inplace=True)

#สั่งให้คำสั่ง Drop Active
df_copy.drop(df_copy.iloc[[df_copy.shape[0]-1]].index, inplace=True)

#กรณีเพิ่ม Column เพิ่ม Column Ging โดยให้ใส่ค่า Random เข้าไป  np.random.randn(df_copy.shape[0])
df_copy['ging'] = pd.Series(np.random.randn(df_copy.shape[0]))
df_copy.head()

# Delete Column
del df_copy['ging']

#check Null Data
df_drop = df.copy()  #copy new data frame = df_drop
df_drop.isnull().sum() #check null data
 **จะแสดงผลรวมของค่า Null แต่ล่ะ Column

# ลบค่า Null ออกจากข้อมูล ลบออกจาก field Embarked
df_drop.dropna(subset=['Embarked'], inplace =True)
df_drop.shape

#check Null ของ Pclass = 1 และ Age = null
df_copy =df.copy()

df_copy[df_copy['Pclass'] == 1]['Age'].isnull().value_counts()

#ตรวจสอบค่า Mean
mean1 = df_copy[df_copy['Pclass'] == 1]['Age'].mean()

mean1

#แทนค่า null ด้วยค่า Mean Pclass = 1 และ Age = ค่า 38.23
df_copy.loc[df_copy['Pclass'] ==1, 'Age'] = df_copy[df_copy['Pclass'] == 1]['Age'].fillna(mean1)
df_copy['Age'].value_counts()

#คำถาม จงเติม null (na) อายุของผู้หญิงคลาส 3 ด้วยค่า Median
#กำหนดตัวแปล median_f_3 ให้มีค่าเป็น Median =[21.5]

median_f_3 = df_copy[(df_copy['Pclass'] == 3) & (df_copy['Sex'] == 'female')]['Age'].median()

median_f_3

# เพิ่มค่า null โดยค่า Median
# loc = Filter เฉพาะคอลัมน์ที่มีค่าตามที่เราต้องการ, iloc Filter แบบ Index

df_copy.loc[(df_copy['Pclass'] == 3) & (df_copy['Sex'] == 'female'),'Age'] = df_copy[(df_copy['Pclass'] == 3) & (df_copy['Sex'] == 'female')]['Age'].fillna(median_f_3)

#แสดงค่า valud_counts()
df_copy[(df_copy['Pclass'] == 3) & (df_copy['Sex'] == 'female')]['Age'].value_counts()


#การ Convert ค่า String --> Int
#แปลงจาก Sex = male ให้ไปสร้าง Column ใหม่ชื่อว่า Sex_num โดยกำหนด ชายให้ =1, หญิง=0
df_pre.loc[(df_pre['Sex']=='male'), 'Sex_num'] = 1
df_pre.loc[(df_pre['Sex']=='female'), 'Sex_num'] = 0

#แสดงข้อมูล
df_pre.head()