วันจันทร์ที่ 15 สิงหาคม พ.ศ. 2565
วันจันทร์ที่ 1 สิงหาคม พ.ศ. 2565
วันจันทร์ที่ 18 พฤษภาคม พ.ศ. 2563
PHP เพิ่ม - ลด - วันเวลา
<?php
function thaiLdate($vardate="") {
$_month_name = array("01"=>"มกราคม", "02"=>"กุมภาพันธ์", "03"=>"มีนาคม","04"=>"เมษายน", "05"=>"พฤษภาคม", "06"=>"มิถุนายน", "07"=>"กรกฎาคม", "08"=>"สิงหาคม", "09"=>"กันยายน", "10"=>"ตุลาคม", "11"=>"พฤศจิกายน", "12"=>"ธันวาคม");
$yy =substr($vardate,0,4);$mm =substr($vardate,5,2);$dd =substr($vardate,8,2);
$yy += 543;
if ($yy==543){
$dateT = "-";
}else{
$dateT=$dd ." ".$_month_name[$mm]." ".$yy;
}
return $dateT;
}
echo thaiLdate(Date("Y-m-d", strtotime("$theData[6] - 1 DAY"))) // ลด 1 วัน , Month, Year
?>
วันศุกร์ที่ 26 เมษายน พ.ศ. 2562
PHP สร้าง Text File // อ่าน Text File
การสร้าง Text File
<?php
$myfile = fopen("sk_fore.txt", "w") or die("Unable to open file!");
$txt = number_format($row_rs_eff2for[forebay],2);
fwrite($myfile, $txt);
$txt = "|".$row_rs_eff2for[eff_storage];
fwrite($myfile, $txt);
$txt = "|".$row_rs_eff2for_ncc[forebay];
fwrite($myfile, $txt);
$txt = "|".$row_rs_eff2for_ncc[eff_storage];
fwrite($myfile, $txt);
fclose($myfile);
?>
การอ่าน Text File
<?php
$myFile = "../../sk/sk_fore.txt";
$fh = fopen($myFile, 'r');
$theData = explode("|",fread($fh, filesize($myFile)));
fclose($fh);
?>
นำไปแสดงผล
<tr>
<td colspan="3" rowspan="3" background="images/sk_graphic4_65.gif"><input name="textfield" type="text" class="style11" value="<?=number_format($theData[1],2);?>" size="8" maxlength="10"> </td>
<?php
$myfile = fopen("sk_fore.txt", "w") or die("Unable to open file!");
$txt = number_format($row_rs_eff2for[forebay],2);
fwrite($myfile, $txt);
$txt = "|".$row_rs_eff2for[eff_storage];
fwrite($myfile, $txt);
$txt = "|".$row_rs_eff2for_ncc[forebay];
fwrite($myfile, $txt);
$txt = "|".$row_rs_eff2for_ncc[eff_storage];
fwrite($myfile, $txt);
fclose($myfile);
?>
การอ่าน Text File
<?php
$myFile = "../../sk/sk_fore.txt";
$fh = fopen($myFile, 'r');
$theData = explode("|",fread($fh, filesize($myFile)));
fclose($fh);
?>
นำไปแสดงผล
<tr>
<td colspan="3" rowspan="3" background="images/sk_graphic4_65.gif"><input name="textfield" type="text" class="style11" value="<?=number_format($theData[1],2);?>" size="8" maxlength="10"> </td>
PHP การบวกเพิ่มค่าแบบทวีคูณ โดย Dreamweaver
mysql_select_db($database_sk50, $sk50);
$query_rs_inf_rel = "SELECT plan_ncc_data.mydate as r_date, plan_ncc_data.inflow_ncc as inflow_ncc, plan_ncc_data.release_ncc as release24, plan_ncc_data.inflow_61 as inflow24 FROM xxxxx WHERE plan_ncc_data.mydate BETWEEN '$input1' AND '$input2'";
$rs_inf_rel = mysql_query($query_rs_inf_rel, $sk50) or die(mysql_error());
$row_rs_inf_rel = mysql_fetch_assoc($rs_inf_rel);
$totalRows_rs_inf_rel = mysql_num_rows($rs_inf_rel);
$sumdiff= $row_show_eff['eff_now'];
do {
$wdiff = $row_rs_inf_rel['inflow24'] - $row_rs_inf_rel['release24'];
$wdiff_ncc = $row_rs_inf_rel['inflow_ncc'] - $row_rs_inf_rel['release24'];
$sumdiff =$sumdiff +$wdiff ; //บวกเพิ่มค่าตัวที่ 1
$sumdiff1 =$sumdiff +$wdiff_ncc ; //บวกเพิ่มค่าตัวที่ 2
// กำหนดเก็บข้อมูลในรูปแบบ array
$mydt[] = $row_rs_inf_rel['r_date'];
$inflow_24[] = $row_rs_inf_rel['inflow24'];
$release_24[] = $row_rs_inf_rel['release24'];
$inflow_ncc[] = $row_rs_inf_rel['inflow_ncc'];
$wdiff_24[]=$wdiff;
$wdiff_ncc1[]=$wdiff_ncc;
$sumdiff_24[] = $sumdiff;
$sumdiff_ncc[] = $sumdiff1;
} while ($row_rs_inf_rel = mysql_fetch_assoc($rs_inf_rel));
วันจันทร์ที่ 11 กุมภาพันธ์ พ.ศ. 2562
Python การ Plot กราฟ แบบต่าง ๆ
import pandas as pd
import numpy as np
import matplotlib.pyplot as plt
df = pd.read_csv('titanic_data.csv')
#ตรวจสอบค่า na
df_pre.isnull().sum()
#ลบค่า na
df_pre.dropna(inplace=True)
df_pre.isnull().sum()
#ลบ Column
del df_pre['Cabin']
#การเตรียมข้อมูล กำหนดค่า na ให้มีค่า ของ Feild 'Age' ด้วย Mean
# โดยเงื่อนไขว่าให้หาค่าเฉลี่ยอายุของแต่ละ Class แล้วเติมค่าใน na
mean1 = df_pre[df_pre['Pclass'] == 1]['Age'].mean()
df_pre.loc[df_pre['Pclass'] ==1,'Age'] = df_pre[df_pre['Pclass'] == 1]['Age'].fillna(mean1)
mean2 = df_pre[df_pre['Pclass'] ==2]['Age'].mean()
df_pre.loc[df_pre['Pclass'] ==2,'Age'] = df_pre[df_pre['Pclass'] ==2]['Age'].fillna(mean2)
mean3 = df_pre[df_pre['Pclass'] ==3]['Age'].mean()
df_pre.loc[df_pre['Pclass'] ==3,'Age'] = df_pre[df_pre['Pclass'] ==3]['Age'].fillna(mean3)
df_pre['Age'].isnull().value_counts()
#Plot โดยใช้ hist //bins คือจำนวนแกน
plt.hist(df_pre['Age'],bins=5)

# กำหนดขนาดของกราฟ
from matplotlib import rcParams
rcParams['figure.figsize'] = 11.7,8.27 # figure size in inches
# การใช้ seaborn
sns.distplot(df_pre['Age'], bins = 10)
 sns.distplot(df_pre['Age'], hist=False)
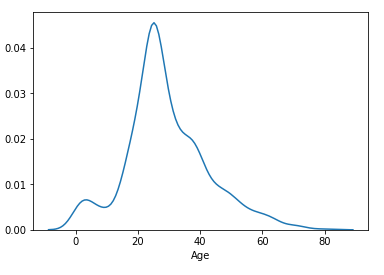 sns.distplot(df_pre['Age'], hist=False, color='red')

sns.boxenplot(df_pre['Age'])
 sns.boxenplot(df_pre['Sex'],df_pre['Age'])

sns.boxenplot(df_pre['Pclass'],df_pre['Age'])
 sns.violinplot(df_pre['Age'])

sns.violinplot(df_pre[df_pre['Pclass']==1]['Age'], df_pre['Sex'])

sns.kdeplot(df_pre['Age'], cumulative=True)
 sns.pairplot(df_pre)
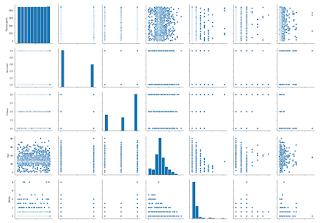
sns.pairplot(df_pre, kind='reg')

sns.jointplot(x='Age', y='Survived', data=df_pre, kind='reg')
 sns.catplot(x='Pclass', y='Survived', data=df_pre, kind='violin', height=10)
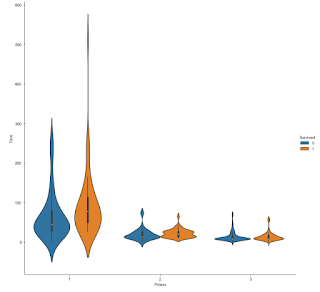
 sns.catplot(x='Pclass', y='Fare', hue ='Survived', data=df_pre, kind='violin', height=10)
 sns.catplot(x='Pclass', y='Fare', hue ='Sex_num', col='Survived', data=df_pre, kind='bar', height=10)
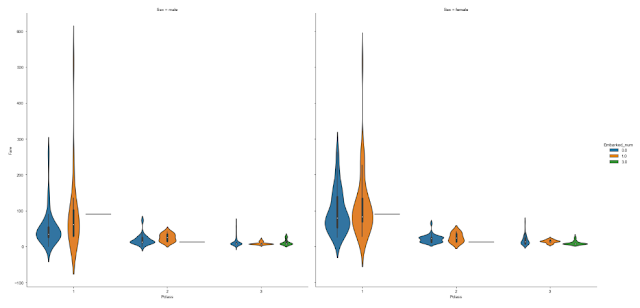
 sns.catplot(x='Pclass', y='Fare', hue='Embarked_num', col = 'Sex', data=df_pre, kind='violin', height=10)
sns.catplot(x='Pclass', y='Fare', hue='Embarked_num', col = 'Sex', data=df_pre, kind='bar', height=10)
 df_pre.loc[(df_pre['Embarked']=='Q') & (df_pre['Pclass']==1)]

import numpy as np
import matplotlib.pyplot as plt
df = pd.read_csv('titanic_data.csv')
#ตรวจสอบค่า na
df_pre.isnull().sum()
#ลบค่า na
df_pre.dropna(inplace=True)
df_pre.isnull().sum()
#ลบ Column
del df_pre['Cabin']
#การเตรียมข้อมูล กำหนดค่า na ให้มีค่า ของ Feild 'Age' ด้วย Mean
# โดยเงื่อนไขว่าให้หาค่าเฉลี่ยอายุของแต่ละ Class แล้วเติมค่าใน na
mean1 = df_pre[df_pre['Pclass'] == 1]['Age'].mean()
df_pre.loc[df_pre['Pclass'] ==1,'Age'] = df_pre[df_pre['Pclass'] == 1]['Age'].fillna(mean1)
mean2 = df_pre[df_pre['Pclass'] ==2]['Age'].mean()
df_pre.loc[df_pre['Pclass'] ==2,'Age'] = df_pre[df_pre['Pclass'] ==2]['Age'].fillna(mean2)
mean3 = df_pre[df_pre['Pclass'] ==3]['Age'].mean()
df_pre.loc[df_pre['Pclass'] ==3,'Age'] = df_pre[df_pre['Pclass'] ==3]['Age'].fillna(mean3)
df_pre['Age'].isnull().value_counts()
#Plot โดยใช้ hist //bins คือจำนวนแกน
plt.hist(df_pre['Age'],bins=5)

# การใช้ seaborn
import seaborn as sns# กำหนดขนาดของกราฟ
from matplotlib import rcParams
rcParams['figure.figsize'] = 11.7,8.27 # figure size in inches
# การใช้ seaborn
sns.distplot(df_pre['Age'], bins = 10)

sns.boxenplot(df_pre['Age'])


sns.boxenplot(df_pre['Pclass'],df_pre['Age'])


sns.violinplot(df_pre[df_pre['Pclass']==1]['Age'], df_pre['Sex'])

sns.kdeplot(df_pre['Age'], cumulative=True)


sns.catplot(x='Pclass', y='Fare', hue='Embarked_num', col = 'Sex', data=df_pre, kind='bar', height=10)


สมัครสมาชิก:
บทความ (Atom)